They tell your story, inspiring and with humor like you would do face-to-face…..but then on your niche site.
You want to tell your story, how do you do that best to attract an audience of loyal followers, it’s to show your own style.
Nowadays you see them popping up everywhere, infographics are very hot. They are also increasingly being used in the Netherlands to make a story clear. And for good reason.
Combining an image with data visualization and explanation fills the void that these separate forms of communication have.
How Does An Infographic Work?
The problem with using just text
Texts can be built from an almost infinite combination of words. This incredible wealth of possibilities ensures that you can make a very deep analysis of concepts in which you can explain everything down to the last detail.
Unfortunately, the feasibility of this relies entirely on the reader’s ability to process this information. And large amounts of text are often difficult to digest.
In addition, it is difficult to show relationships using words without showing a visual representation of these relationships.
The problem with using just images
Images may be easier for the reader to understand, but they are less suitable for fully explaining abstract and complex concepts.
Just data visualization
Data visualization can perfectly show key metrics and show the differences between segments, or different groups, but can’t tell the story behind the numbers very well.
Winner is the combination
Here are 7 types of infographics that can each fulfill a different purpose:
Not Only Your Story Matters
Also the way you present it and your design. We could also have made the infographic like this:
Exactly the same texts and the same dates, but still looks very different. Personally, I like the top one nicer, clearer and with a better design. We always coordinate a design with you.
Cost of having an infographic made
Have you already worked out exactly what text and data should be included? Or do you have more of an outline of the story?
With all of the above in mind, let’s take a look at different infographic design resources and what you can get for your money.
Create your own infographics with Canva
PiktoChart is a design tool you can use to create an infographic from scratch. It requires you to have your design in mind and your information to hand because no one is helping you put anything together.
They allow you to create as many images as you want, and their editor is quite easy to use, although it tends to lean to the side of the “grid-based charts” design style.
Surely it’s harder to do something completely free with such a drag and drop editor.
It’s free to sign up for their tool, but you can’t do much without paying for a package.
Currently they have two packages:
- One is $15 a month and gives you access to their 600+ graphic templates. You can upload up to 100MB of your own images to use, but no more. You can also download your projects only in standard quality.
- The second package costs $29 per month, so double the cost. You will still get the templates, but the photo upload limit will be increased to 400MB. You can also download your images in print quality, as PDFs, or even as SlideShare decks. You can password protect them or make them private if you want. You also have to pay for the second tier to have white-labeled images; otherwise they will deliver your projects with watermarks.
Create your own infographics with Canva
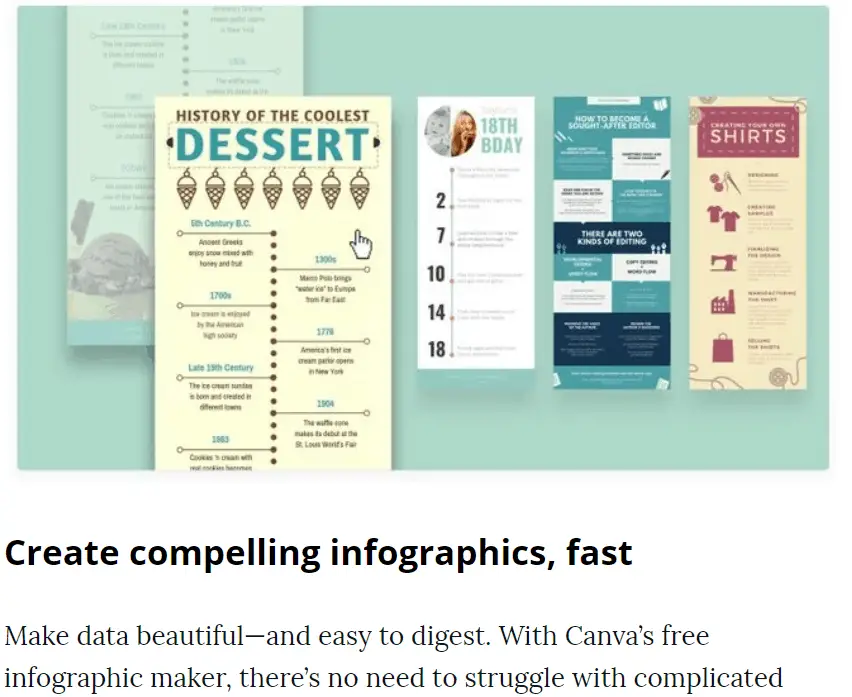
I’ve definitely mentioned Canva before on this site, because it’s an excellent tool to use for all kinds of graphic designs.
I love Canva they have dozens of templates and a huge library of free images and design elements for you to use. The paid version gives you just about an unlimited number of graphics and icons to use on your infographics.
Canva’s pricing model is extremely flexible, meaning you can create images completely for free, or spend hundreds, depending on how many elements you want and how big your projects get.
Like PiktoChart, it’s a tool you use yourself, it’s just significantly cheaper. Definitely my best choice for a self-service program.
Have infographics made with Only infographics
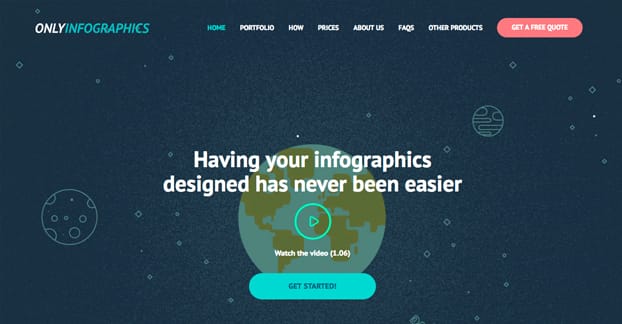
This option is a design company, not a resource. They have worked with a variety of industries but seem to focus on business, finance and medical fields.
They have some excellent illustrations in these images and you can see them in the portfolio on the site.
They promote their ability to get you a draft within a week and they do everything from research, scripting and publishing.
Prices depend on the amount and amount of content needed.
A4 or Letter size images with up to 200 words of content are $400, $500 if you want them to do the content creation as well, and $600 if you want promotion after creation.
Comic-size images with up to 500 words of content are $600 for the design, $800 for the content and design, and $900 if you also want promotion.
The company is also part of the only network of media creators. They will also create explainer videos, presentations, and landing pages if you want.
If you want a total package with a landing page, infographic and video, you can contact them to see if they offer you a special package.
It’s great for English infographics or other graphic projects, but in Dutch it can be trickier, although you often get editable files to change just the titles or you can ask them to replace texts, as long as you specify literally what needs to be replaced for what (and ensures that the Dutch story also fits, Dutch you often need more words to be able to say the same thing).
Set up a competition with Design Hill
This site is a hub for freelancers to compete in design competitions. You submit a contest and you receive submissions from designers, pick the ones you want and work with them to finalize a finished design.
There are some tricky steps along the way, mainly to prevent fraud or content theft and to make sure you pay, but don’t worry about that.
Just be honest and everything will be fine. As for their packages, they have three tiers: standard, executive, and premium.
- Default is $289. You can expect 20+ designers to submit about 40+ designs to choose from. You can also get promotion through newsletter and social media. You get the designs in vector and a variety of image formats to use yourself, and you have full rights to the content created for you.
- Executive is $559. For the price, you get access to the hand-picked higher level designers and can expect 30+ designers to submit 60+ designs for your choice. You can also get blog promotion on top of the other features by default.
- Premium is $829. Your contest is only available to the top crop designers, who are expected to be 40+ responding. Your contest will be flagged in their database, and if you see a specific designer you want, you’ll get a free “paid invite” and then give an extra bit of money to submit a design.
Now there’s something to be said about competitions, and it’s not really beneficial. While a contest may sound like a good idea from a brand’s point of view, from a freelancer’s point of view, it’s sort of exploitative.
Freelancers do a lot of competition submission work and are not compensated unless chosen.
Now I’m not assuming that my comment will make contests go away, but I want you to know that the very best freelancers out there won’t participate in contests because they know better.
They know how much their skills are worth.
Here you also get editable files if you want to translate it into Dutch, or you can ask them to adapt the texts and there are even Dutch-speaking freelancers here and there that you might choose consciously if they come up with a design. come (usually you recognize them by their name).
Outsource infographic to a freelancer on Fiverr or Upwork
Fiverr bills itself as “get what you want for $5”, but it’s not really accurate. Fiverr gigs start at $5, but pretty much every worthwhile service these days has a handful of options or extras that cost more.
For example, this infographic creator creates an image in two days, with up to seven data points and two total revisions, for $5.
That’s very little data, though, and not a lot of revisions if you don’t like the look of some elements of the image.
For $10 you get one with up to 15 data points and 5 revisions, and for $20 you get up to 25 data points and unlimited revisions, as well as the ability to use the image commercially.
Admittedly, this price is still extremely cheap for an infographic. The reason is that the designer – and many other designers on Fiverr – are from Indonesia.
The cost of living in countries like Indonesia and Malaysia is so low that designers can leverage their skills on a site like Fiverr and earn a living wage while undermining anyone working in a country like the Netherlands.
I myself have not yet been able to get good experiences with designers on Fiverr and communicating about Dutch texts with people from Indonesia is probably completely impossible.
I’m much more of an Upwork fan myself. Again, there are many freelancers of dubious quality and for every success you will certainly also have a bad one when you decide to work with a freelancer.
But in my experience it is more than worth that bad apple to have a freelancer with whom you can make many beautiful things relatively cheaply.
I would therefore recommend this if you want to have an infographic made more often. Plus there are also many Dutch freelancers on the platform that you can find by adding “Dutch” to your search.
Often traveling people who want to travel the world and who can earn money with their design skills.
Create an embed code for your graphic
Actually very easy. Siege media has a code generator with which you can easily create an embed code for your visitors.
Here you can find the infographic embed generator.
This way you immediately get credit for your infographic and it is also good for backlinks to your site, which is good for your Google ranking!
It therefore ensures more findability on both social media and in the search engines, and also for greater interaction with your visitors.
In addition, it increases your conversion since at least 67% of customers find a clear image very important. Even more important than any form of text, including product descriptions and even customer reviews.
Furthermore, a good infographic shows that you are an authority on the subject yourself.
You demonstrate that you master the subject matter so well that you can explain all facets of the subject in a well-arranged manner. You can then go further in depth in your accompanying text.
With your image, even a layman can understand the basics of the matter, even if he may not immediately grasp all the underlying facts. That’s what a good infographic designer can do.
Infographic case study
Of course we also made infographics ourselves and here is the setup of the plan from start to finish.
Work out your idea well
To make a good visual, you must first have a good idea. We always work out this idea as far as possible so that the infographic can be made quickly by our design team and the costs can be kept low.
An idea is good if it fits the needs of your target audience. Which piece of knowledge do you want to share with your target group, or more importantly:
What is your target group with?
In this case we wanted to sell link building. We have clear packages with a very logical approach for us: the difficulty of the keywords.
But many of our customers weren’t quite sure what it takes to rank higher in Google, let alone the difficulty factor of keywords.
Our challenge was to be able to explain and sell our packages. The client’s was to know how to rank higher in the search engines.
The approach of the graphic could have been very easy to explain our packages, but this completely misses the point.
The approach has become to explain to the reader in a humorous way what link building does, what effect this has and how you determine your choice for the way of link building.
That eventually led us to this fun Infographic about link building:
Linkbuilding if Google was a Farmer’s Market
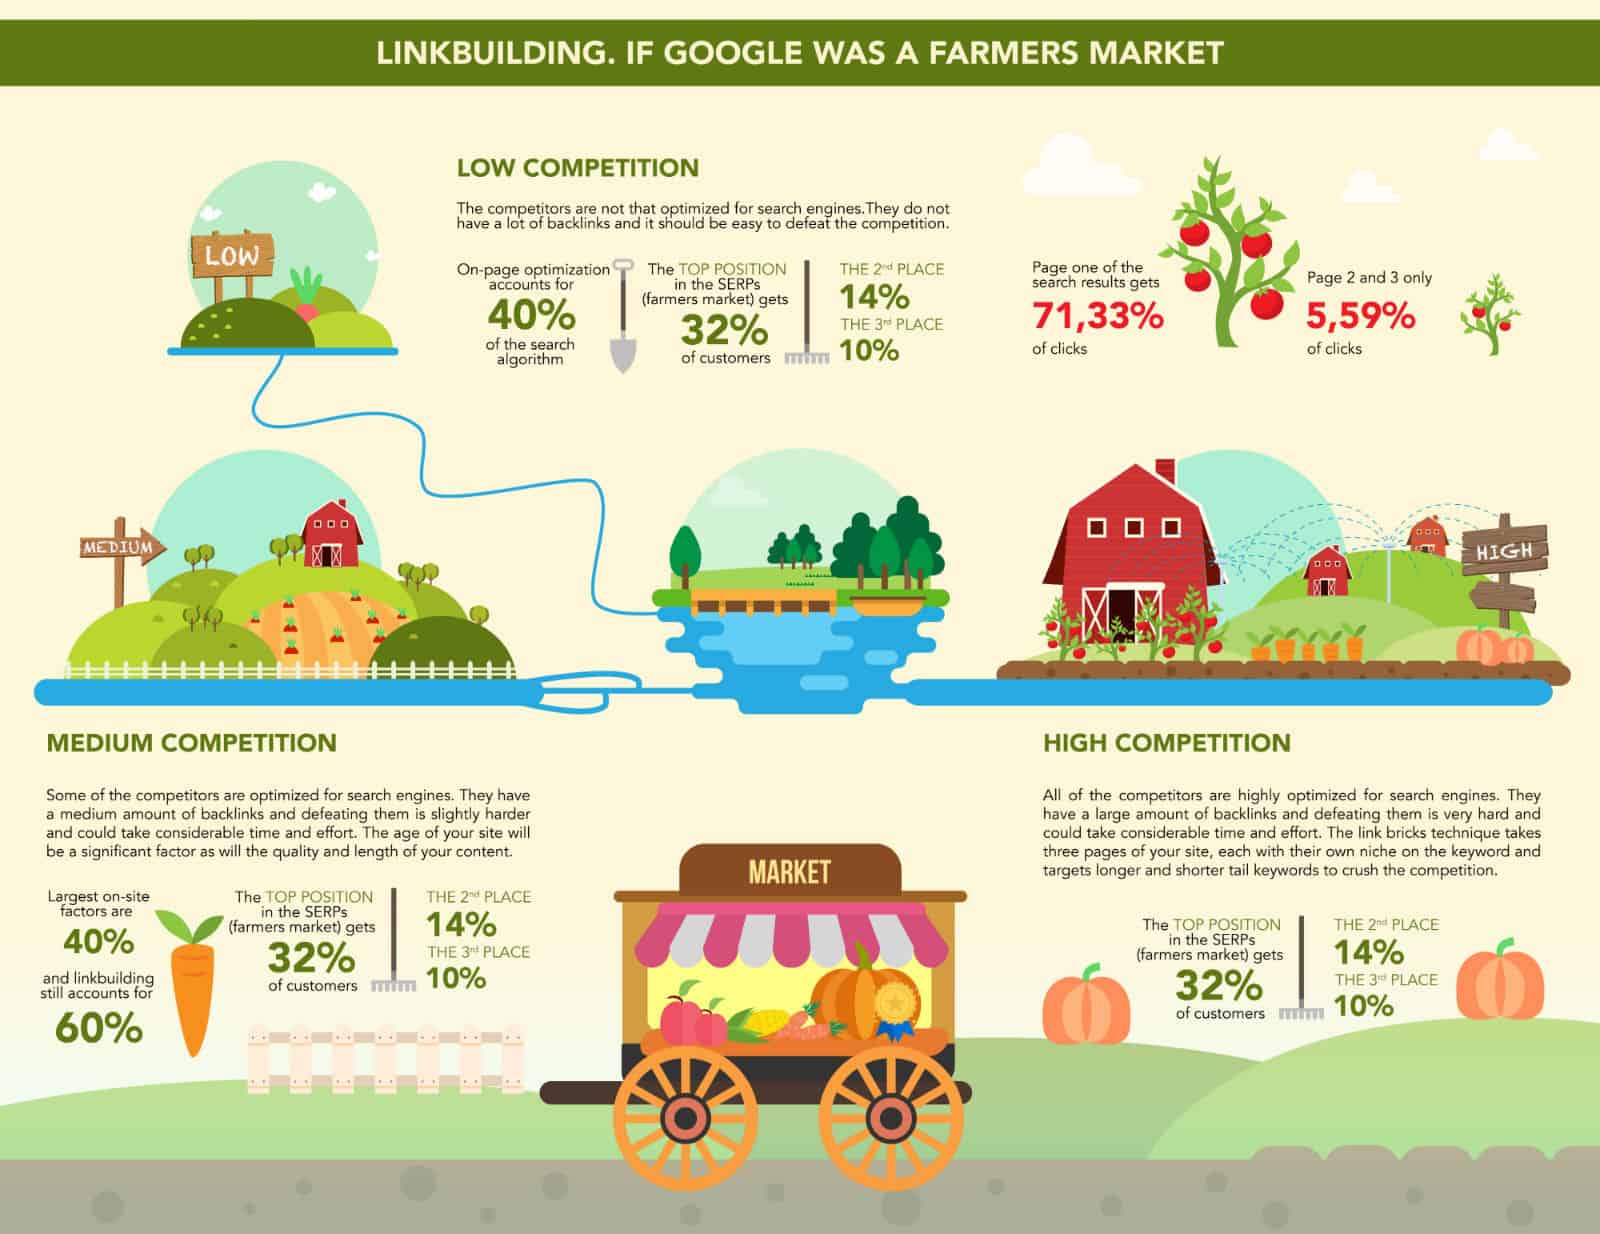
So there you have it…..
Visual Storytelling with infographics: stick with your customer
They tell your story, inspiring and with humor like you would do face-to-face…..but then on your site. Customers today expect a backstory when they do business with a company.
You see it in marketing and for good reason: too many companies want to sell their product and bombard the customer with the features of their product.
When you have customers in your store, you can have a nice chat. This greatly increases the chance that someone will buy something.
Even if you provide business to business services and you can have a nice conversation with your interlocutor, the chance that he will choose you over your competitor is considerable, even if you may be a bit more expensive.
The other only had a sales pitch with an impressive summary of the benefits his service could bring to the customer.
But yeah, that doesn’t really appeal to the imagination.
Why does he choose you? It is mainly about the emotional connection and the ‘granting’.
Many websites are not set up to make a connection. They are cold, distant pages that want to tell you about what the product can do and that is such an eternal shame!
You can’t take the conversation in person, but at least you can give your site a personal touch and give the customer a reason to remember your company among the many competitors they’ve already seen.
Make sure you stick with the customer.
An Infographic can convey a story. Like a picture book to a child, it shows the visitor at a glance what the story is about.
With the way you make the drawings, you can convey your company style and show what you stand for. Your target audience will appreciate this style (if you’ve done your research well) and just as you sit across from them and they think “yes, I want to do business with this person”, they will also have that connection with your company. experience online.
And if you have grabbed the attention, you can also add some characteristics of your product or service, substantiated with figures and nicely designed graphs.
67% of visitors to a site find a clear picture of the product or service the most important source of information on which to base their choice.
Even more important than any kind of on-page text, including product descriptions and even the conversion-enhancing customer reviews that many ecommerce sites focus on.
The cost of Infographics is much lower than focusing on text content.
We are visually oriented for 90% of our daily information intake and only get 10% of our other information from our other senses.
After a hard day’s work you might want to sit back with some pictures because at work you probably read a lot of text, just like me.
But pictures alone are not enough. The smallest children may love to look at books with only pictures. They tell them enough about the story, everything they can understand at that age.
But as we get older, we would like to have more background information about the story. What are someone’s motives or how did he get into this situation?
And even if you still prefer the Donald Duck over a good book, you will already receive quite a bit more information in the form of beautiful speech bubbles.
The pictures give you a first impression, a bird’s-eye view of the subject in one go. They appeal to you because you can immediately understand the main points.
The accompanying texts then help you to understand the underlying information as well. You only need the main lines first and then you can make that deep dive.
The pictures are like a perfectly formulated introductory paragraph that has been able to outline all aspects of what is to come, while also directly highlighting the structure of the subject and the connections between the mutual sub-topics.
Then consider that you were able to process this information in the form of pictures 60,000 times faster than that paragraph of text.
People also naturally like statistics and will remember the numbers and features of what makes your offering unique by linking to those fun images they’ve seen.
You have arranged the overview of the subject. The structure of your story is clear and you have been able to show the connections between sub-topics.
The visitor has the extra background information at his disposal in the form of text so that he can also familiarize himself with the complex matter that lies behind this apparently simple story.
The statistics now help to give value to the whole.
Make comparisons with competitors, show how much impact it all has on the individual or on society and around distinguish segments.
Percentages show at once how much impact something has, hard euros clearly convey the savings or profit and a well-chosen graph can show what has happened in time or what the forecast will be in the future.
Why Do Infographics Work So Well?
You remember 20% of what you read and up to 80% of what you see. So do your visitors.
When you’ve presented them with memorable images that have also formed an emotional connection with the reader, your chances of returning visitors and ultimately customers are much higher than your competition.
Even if a visitor continues shopping or wants to do more research before purchasing a service, he will remember you of your images.

Joost Nusselder is The Content Decoder, a content marketer, dad and loves trying out new tools en tactics. He's been working on a portfolio of niche sites since 2010. Now since 2016 he creates in-depth blog articles together with his team to help loyal readers earn from their own succesful sites.
