In this article, I’ll look at how to get your data out of GA4 and Google Search Console into a format you can better analyze your organic search results with.
The key is in using the API to get your data, so you can use it in any format you like. In this tutorial, I’ll use Lookerstudio to get the data into cool charts and data tables, so you can look at your organic search results in more detail.
Here’s my Lookerstudio template so you can look at your own data using the data selectors.
Lookerstudio GA4 and search console template
The data selectors will be available when you’re logged into the Google account that has access to your Google Analytics and Search Console data.
Here’s the video where I explain how to use this for your search console data:
Google Search Console provides valuable data about your website’s performance on Google’s search engine. However, extracting and visualizing this data in a meaningful way can be challenging.
Introducing Lookerstudio
Formerly known as Google Data Studio, Lookerstudio is a powerful and free tool that allows you to create captivating dashboards using your own data. The best part is that it seamlessly integrates with other Google data sources, including Google Analytics and Google Ads, making it an essential tool for marketers and website owners alike.
Getting Started with Lookerstudio
To get started, you can either create a new report or edit an existing one. Once inside Lookerstudio, you can add your data by connecting to various data sources, such as Google Analytics, Google Ads, and, of course, Google Search Console.
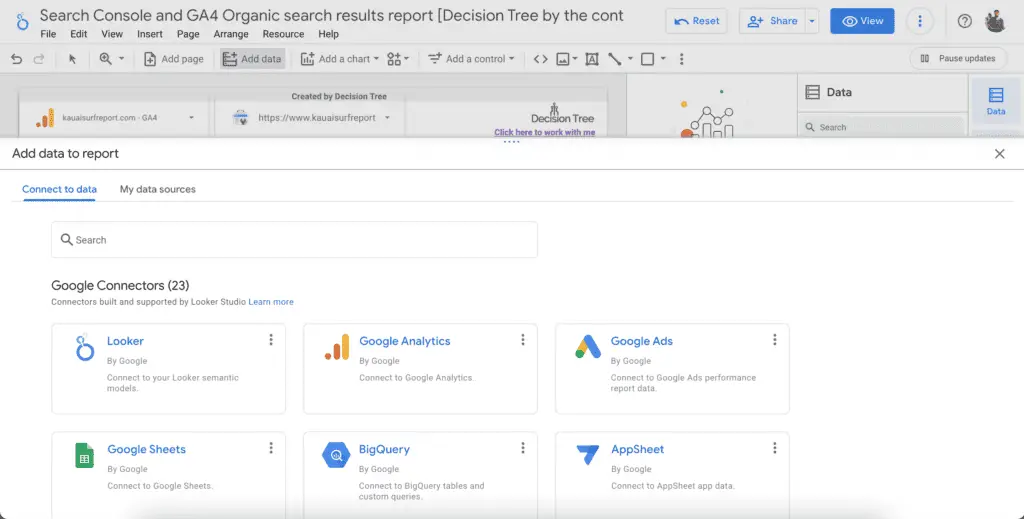
Because you’re logged into Google, you can access any web property you have access to, either your own websites or sites you work on for clients.
By choosing your website, you gain access to essential metrics like clicks, impressions, average position, and click-through rate.
You search console data
Building Custom Graphs
With the power of Google Data Studio, you can now create customized graphs and data tables that reveal the trends and performance of your keywords over time.
For instance, a line chart can be used to track the average position of your top keywords, allowing you to monitor their progress over time.
Two views of the search console API
The search console API provides you with two main views:
- the data for your overall site with queries, position, impressions, and click-through-rates
- the data for your landingpages with the queries each page is ranking for and their respective position, impressions, and click-through-rates
Looking at your overall site with data tables
The real magic lies in the data tables you can create. These tables provide a comprehensive view of all the keywords your website ranks for, along with the corresponding impressions, clicks, click-through rates, and average positions.
You can use filters to isolate specific keywords or types of queries, making it easier to identify areas for improvement.
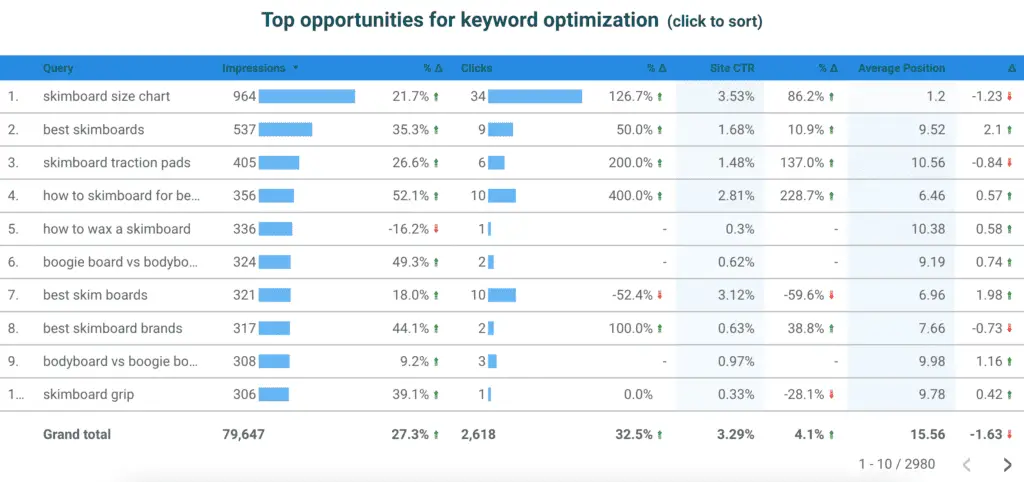
Analyzing the data tables can yield valuable insights. For example, if you find keywords with high rankings but low click-through rates, you may want to experiment with different title ideas to improve their performance.
Conversely, if you identify keywords ranking at the bottom of page one or top of page two, you can focus on optimizing those pages to enhance their rankings.
Looking at each of your pages individually
Lookerstudio also allows you to dive deeper into the performance of specific landing pages. By selecting a particular page, you can see all the keywords it ranks for, along with their impressions, clicks, and click-through rates.
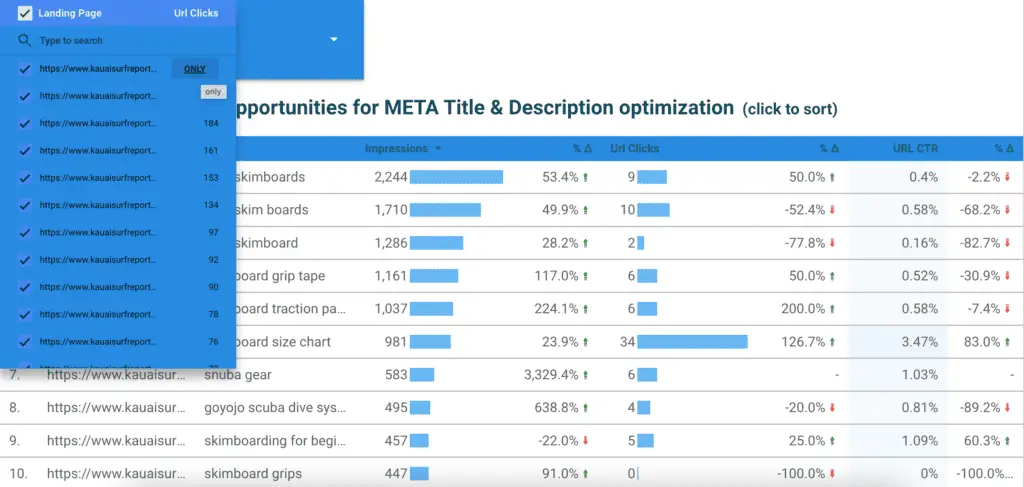
This information proves invaluable when optimizing existing content, as you can identify keywords with untapped potential and create additional content around them.
Addressing Keyword-Page Misunderstandings
Occasionally, Google may misunderstand which page on your website is targeting a specific keyword. In such cases, you can use a graph to detect when different pages begin to rank for the same keyword.
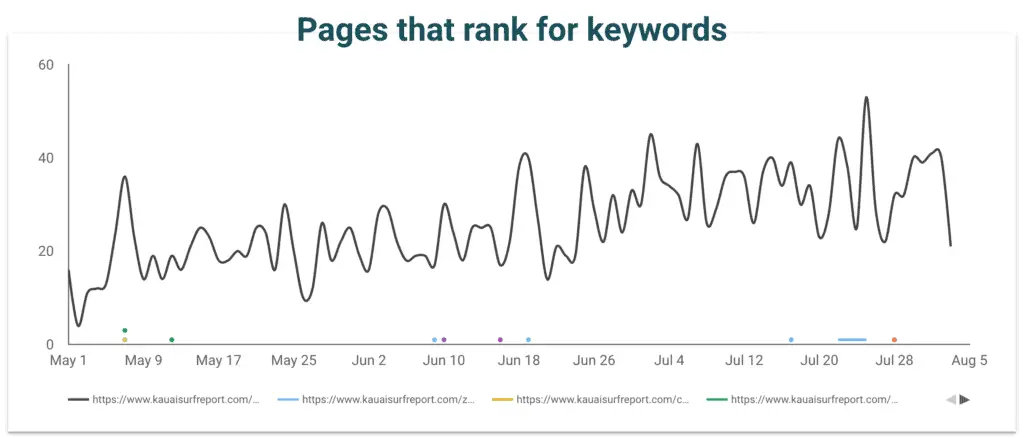
The little dots at the bottom are other pages that are also ranking for the same query occasionally. Sometimes, you even see a page completely being dropped for a particular query and replaced by another page on your site.
This is a clear indication that Google doesn’t understand which page you’re trying to rank for a particular query.
To rectify this, internal linking and changing the semantic structure of the wording on your page can be employed to clarify which page should be associated with the target keyword, thus improving your chances of ranking higher.
Monitoring Search Performance Over Time
Lookerstudio empowers you to assess the overall performance of your site or specific sections over time.
By doing this in Lookerstudio, you can easily look at your website as a whole, but also filter on a specific query or group of queries using the filters.
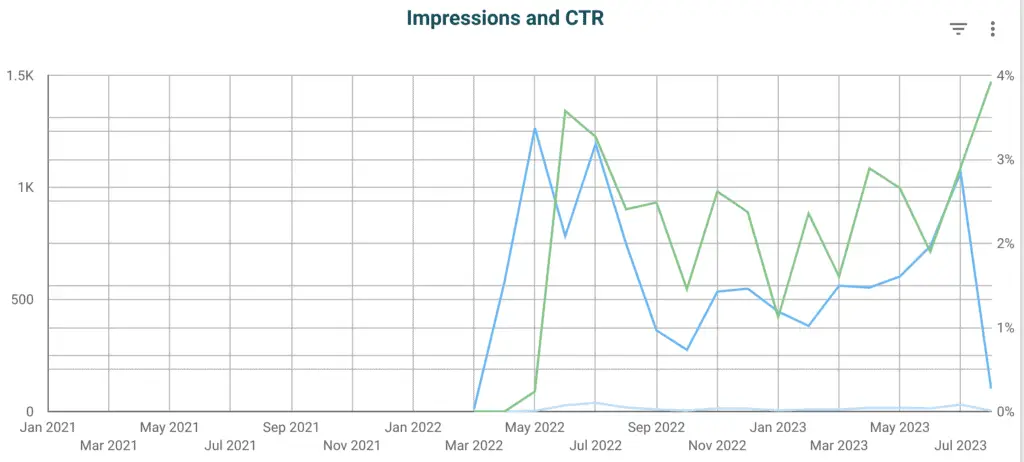
By analyzing impressions, URL clicks, and click-through rates, you can gain a holistic understanding of how your website is performing and identify areas for improvement.
Conclusion
Leveraging Lookerstudio to visualize your Google Search Console and GA4 data unlocks a treasure trove of invaluable insights. By creating customized data tables and graphs, you can track the performance of keywords, landing pages, and overall website traffic, enabling you to optimize your website effectively.
With this powerful tool at your disposal, you can make data-driven decisions that lead to improved search engine visibility and better website performance.

Joost Nusselder is The Content Decoder, a content marketer, dad and loves trying out new tools en tactics. He's been working on a portfolio of niche sites since 2010. Now since 2016 he creates in-depth blog articles together with his team to help loyal readers earn from their own succesful sites.