Anyone building a niche site should be aware of their metrics. How else can you optimize your efforts?
That’s where Ezoic’s Big Data Analytics comes in. A one-stop-shop for analyzing your data.
It’s way more than just having insights into where your EzoicAd revenue is coming from, and I’ll show you how to use it in this review/ tutorial.
Let’s first look at what it is exactly.
What is Ezoic Big Data Analytics
Big Data Analytics is a data platform within the Ezoic suite of products. You get access to it when you activate EzoicAds, the display ad side of things.
Because you’ve integrated your site you get a lot of data on the type of traffic that come though it. Combined with data on the type of ads and revenue you get this is a powerful web analytics tool.
You can also connect your Google Search Console account to gain even more insights, and there are metrics on site speed and loading time.
Ezoic Big Data Analytics review
- Data you can’t get anywhere else
- Combine user metrics with revenue metrics to optimize your site
- Can be slow to load
Big Data Analytics gives me invaluable insights into my niche sites. It helps me to focus on content that performs best from a revenue standpoint but also gives metrics on UX and performance behavior.
I couldn’t do as well as I do (check my income reports here) without it.
I use it as much as I do Google Analytics and Search Console.
There are some reports where I wish I could get the data over time, and it only shows you the aggregate, and sometimes the reports can’t load because there’s just too much data in them.
When I select a full year of data and want a granular report, for example. It doesn’t like that.
But that’s just a minor issue compared to all the insights it provides.
How to optimize your site with Ezoic Big Data Analytics
There are many insights you can gather from the platform, and I’ll give you the ones that I regularly use so you can add them to your routine.
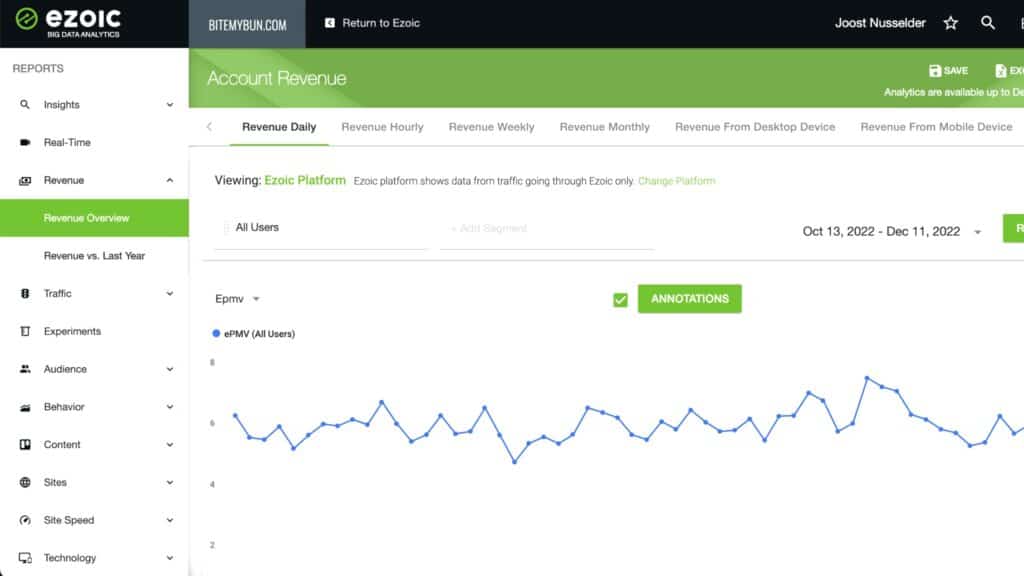
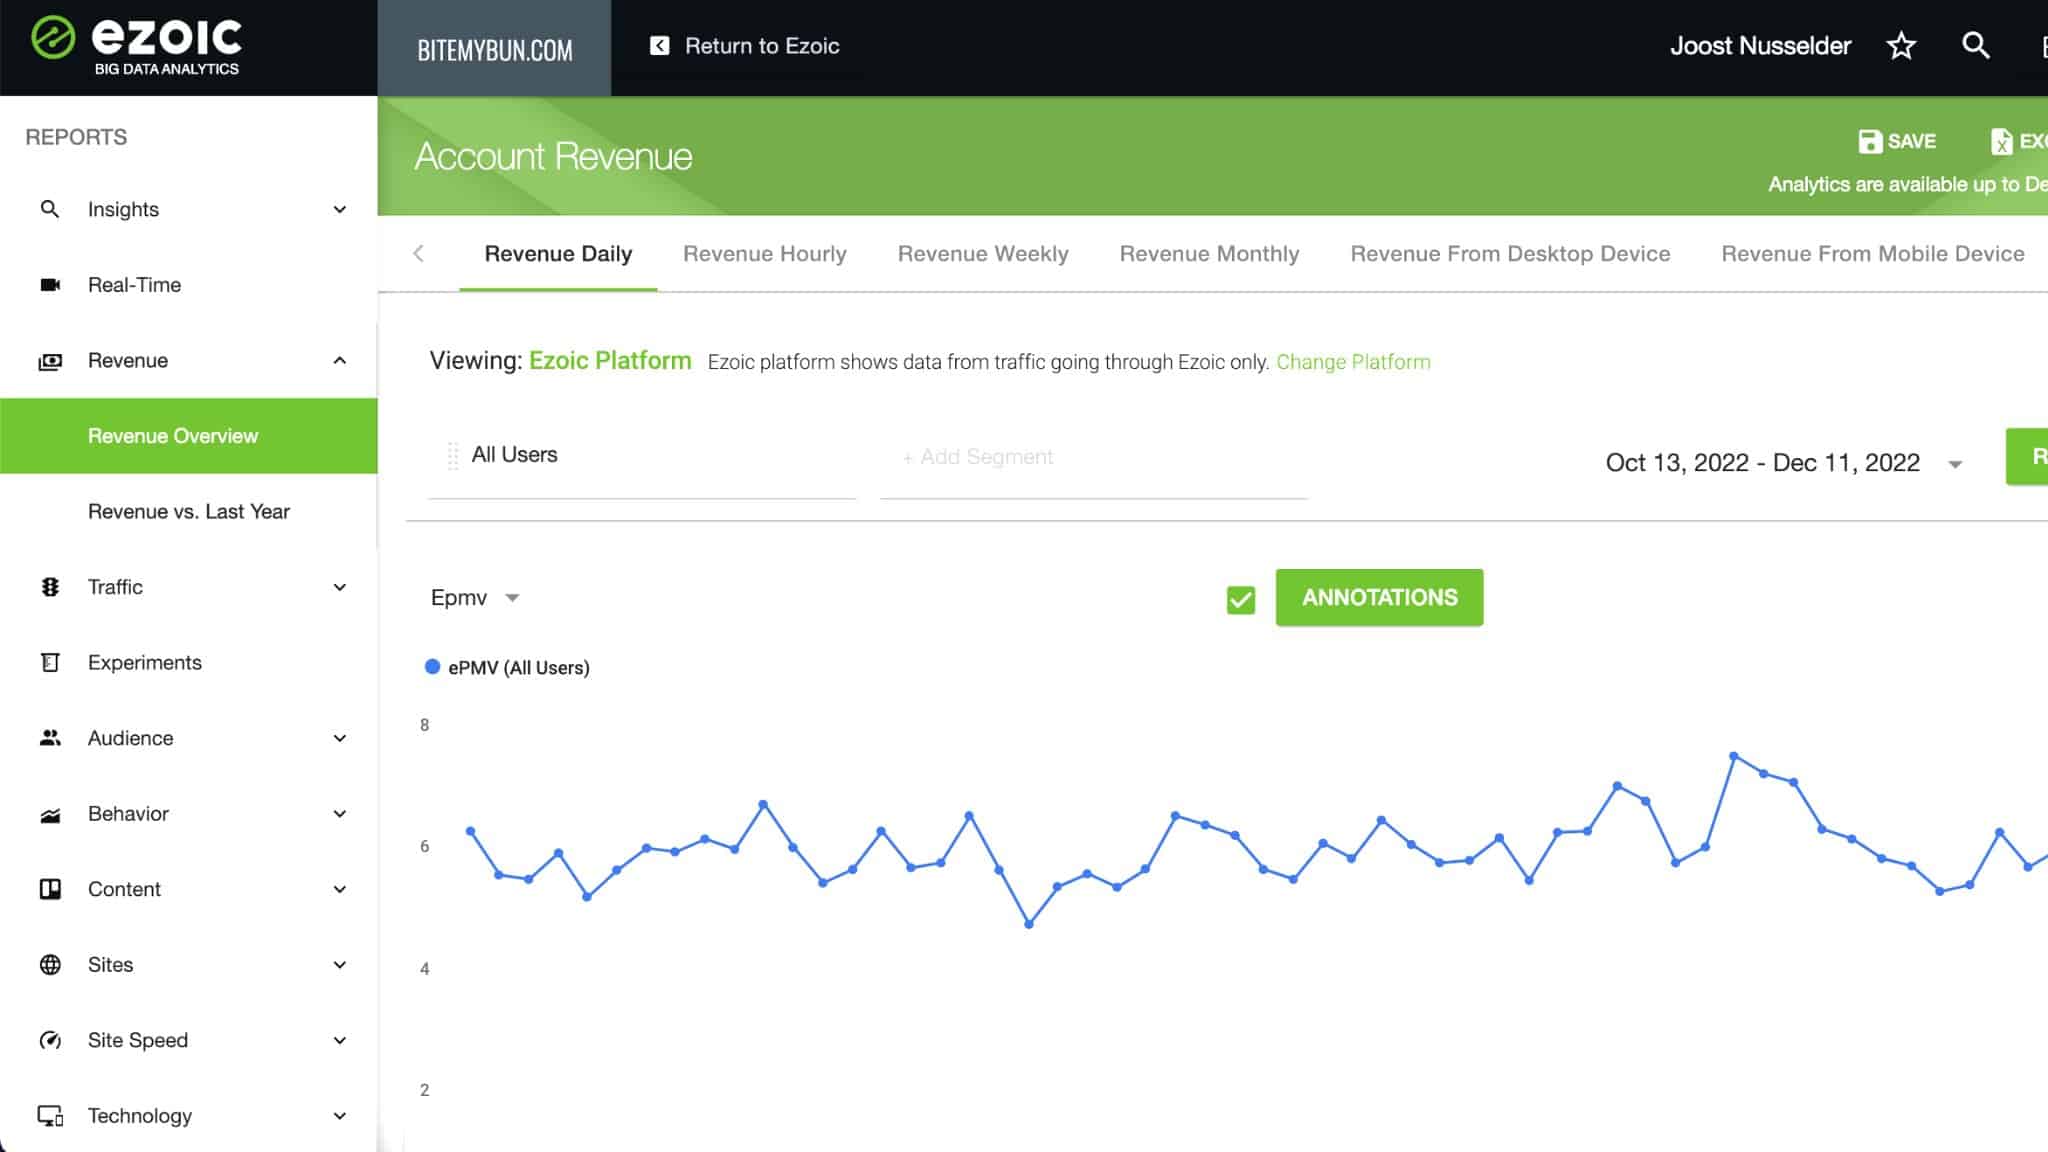
Revenue Overview
This is sort of the landing page of the platform when you first load it.
It gives you your revenue from the last 30 days, something you’ll probably check regularly, so you know what to expect in your bank account.
It gets more interesting if you adjust the time filter to the last year (or the last 365 days) and set the metric shown to revenue monthly.
Now you can really see the progress you’re making:
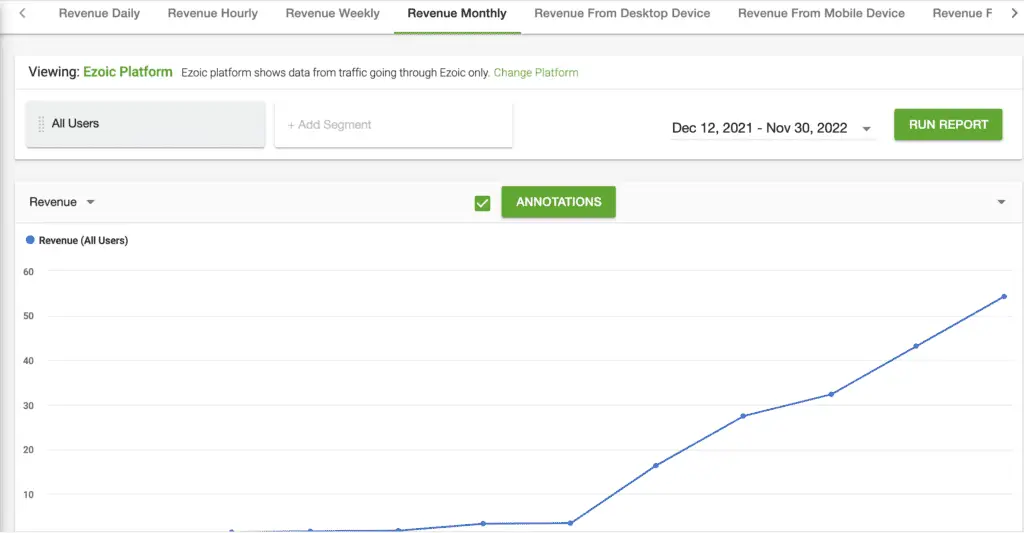
That’s one of my favorite things to look at each month.
The overview gives you insights into:
- Revenue
- % new visits
- Average engaged time/ visit
- Average visit duration
- Bounce rate
- Copy paste/ visit (I don’t actually know what that is, I had to Google it and “the number of times a visitor copies a piece of content from a publisher’s website during a user session”)
- Engaged pageviews
- Engaged pageviews/ visit
- ePMV
- Navigation bounces
- Pageviews
- Pageviews/ visit
- Shares/ visit
- Visit navigation bounces per visit
- Visits
That’s a lot of data, and depending on your goals, you might have other metrics you want to follow. I like to check the revenue, ePMV, bounce rate, and average engaged time per visit regularly.
This way I can quickly see if anything is going the wrong way with any of my sites.
I also like the annotation feature, which allows you to set a marker on the graph.
If you’ve made any major changes and want to track the metrics after that change, you can set the marker for the date you implemented the changes and always see it on the graph.
This might give you insights if your changes made a difference in performance.
Audience
I use the audience data the tool gives me a lot. Especially the audience by location because I have a very international site.
But even if you only target English-speaking languages, you still get a lot of data on US, UK, Australian, and many other countries.
For ads, the ePMV by country is amazing to know. The difference in ePMV for US and non-US traffic is astounding.
This allows me to focus our informational content towards our US sites, and focus more on affiliate marketing for our EU sites.
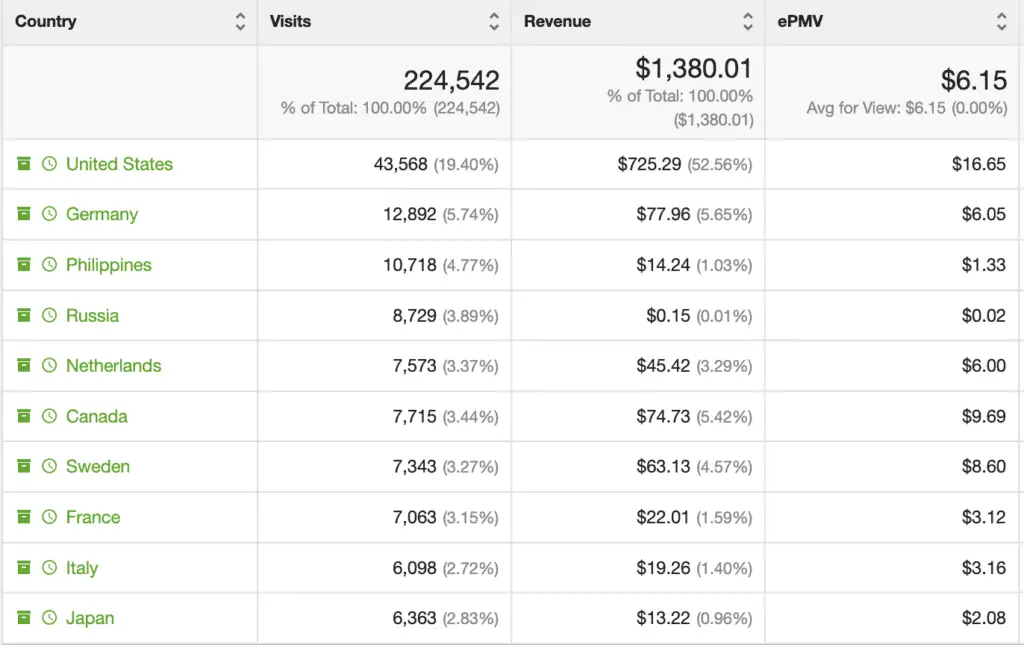
You can also see if visitors from other countries engage with your content more or less than US visitors.
Navigation Bounces
This is an awesome report and one I haven’t seen in any other analytics tools. It looks at your pages and checks if people are leaving the page very quickly.
A bounce is when a visitor lands on your site and immediately returns to the SERP. A navigational bounce also takes into account internal bounces. So if a visitor clicks on a link to go to another page of your site but then clicks back quickly, that counts as a navigational bounce.
This report let’s me see pages that I need to adjust to be more in line with what users might expect.
Or I might need to change a link to that page where it makes no sense, or rephrase the anchor text to be more congruent with the pages’ content.
Visit depth
This is a pure ad rev report for me, because I like the way it shows me how much I earn from each consecutive pageview.
For example, when someone clicks to go to a second page, that earns me another $3.72 ePMV. And each pageview after that as well.
The first pageview is worth the most because of ad targeting.
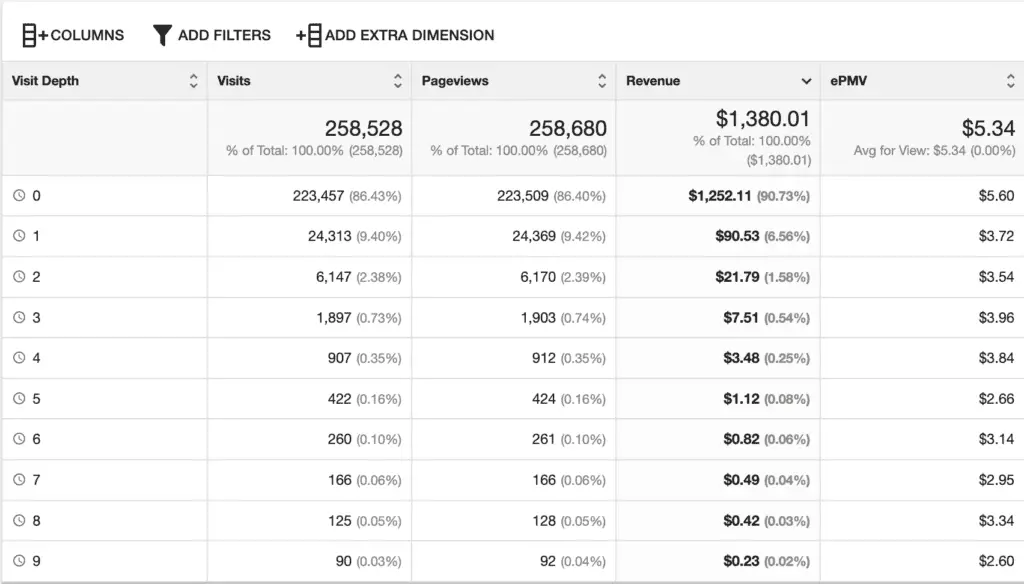
Some advertisers want to reach the people that visit my site, but once they’ve reached them with an ad, they might bid a little lower or not at all on the next pageview.
But after the first page, each pageview after that is worth around the same.
This isn’t a metric I check regularly, but it keeps my eye on the ball regarding what I need to do to get more revenue.
Getting a person to click on a new page is almost as valuable as getting a new visitor.
Landing Pages
The content tab is essential in any toolkit. This is the report I check most often. The revenue per landing page is my most valuable metric as a publisher.
But the ePMV per landing page is even more powerful. Now I can see which pages on my site have the highest ePMV.
That way, I know on what type of content to focus more for the highest revenue per visitor.
First, I create a filter on the amount of page views. I set it to 100 because this gives me the best results.
It filters out pages with only a few visitors, which could skew the metrics because those visitors were high-value targets for retargeting ads for example, but leaves enough pages to give me lots of insights.
The number could be more or less for you depending on the size of your site.
Then I sort the data by ePMV from highest to lowest, and check the results.
When you look at the type of pages with a high ePMV, a pattern might emerge on the type of content that does well, where advertisers are willing to pay more for an ad placement.
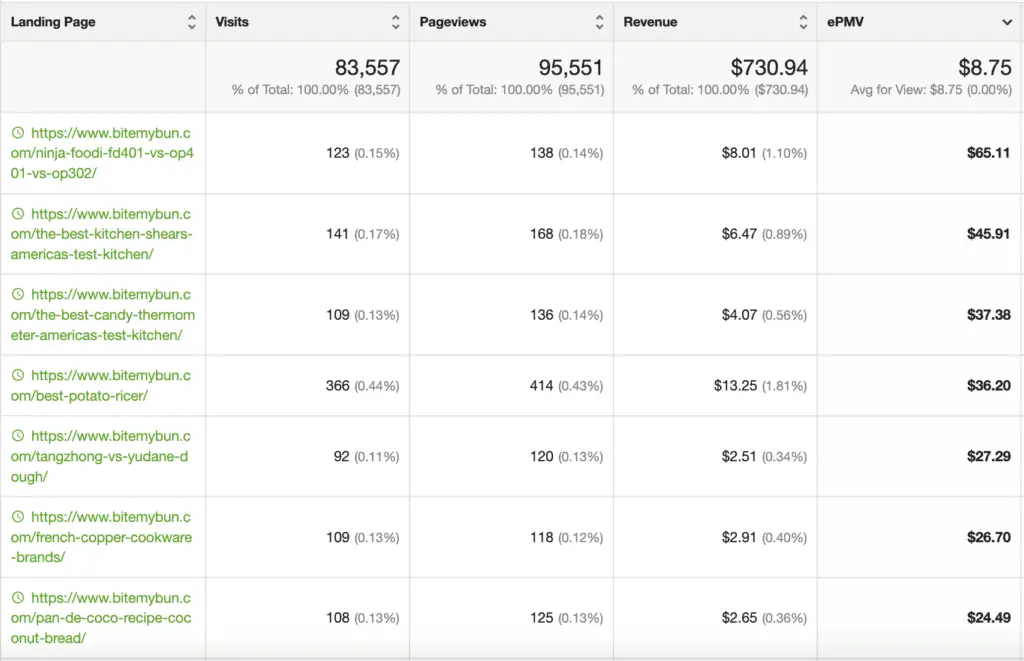
That’s the sort of content you should write more of.
Page Details
This report gives me insights into the amount of words on a page and the other metrics.
This can inform you about the best-performing article length on your site.
It shows me that article length does matter for RPM, but not nearly enough as the amount of extra effort it would cost to add that much content to every post.
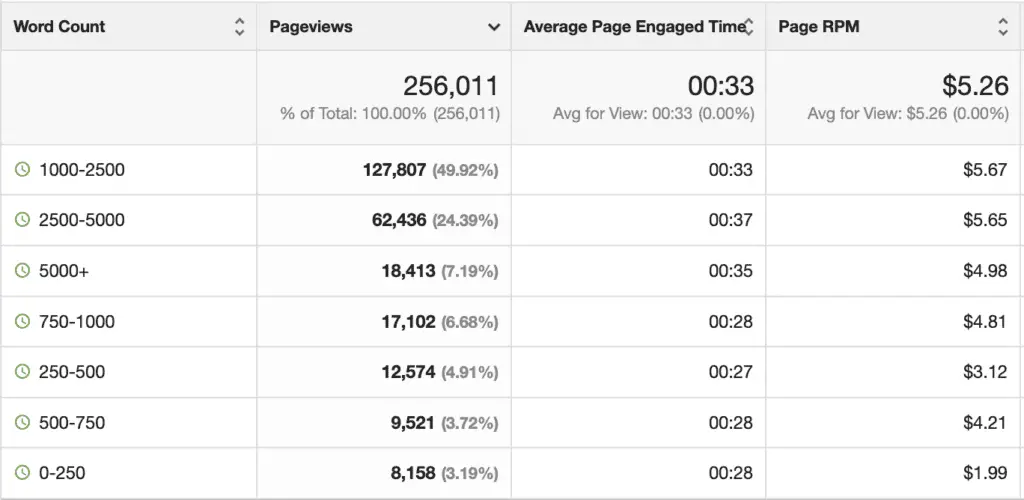
The RPM really starts decline with sub-500 word articles though, so I tend to stay away from those. For SEO and revenue.
You’ll also notice Ezoic talks about RPM here instead of ePMV.
With the landing page report you can see the ePMV. That’s because ePMV is a metric for a whole visit. How much you earn per 1,000 visits, or earnings per mile visits.
When someone lands on a particular page and then clicks on, that revenue can all be attributed to the landing page.
When analyzing a single page, you can’t use the ePMV metric because you’re only looking at that single page, not at the visit.
That’s because a person could have entered your site on that page, but could also have come to that page by clicking through from another page.
So ePMV is the revenue for the whole visit, RPM is the revenue for that one single page.
Author Metrics
This could be a really cool report if you have several authors writing for your site under their own name, or each under a different pseudonym.
I publish everything under my name so I can’t use this report, but I would love to have the data on how the articles of each writer perform so I can instruct them better.
Engagement time or bounce rate per writer for example could indicate which writers give you more engaging posts, so you can instruct others to write the same way.
Or give bonusses or even lay some writers off based on their writing style.
Categories
I like to use the landing pages tab more than the categories tab because it can give you a more granular insight into what type of pages perform well, but you can also take a look at the categories on your site.
I only use a few categories on a large site, so this report isn’t as detailed for me.
The more detailed categories you have the more this report can inform you of differences between them.
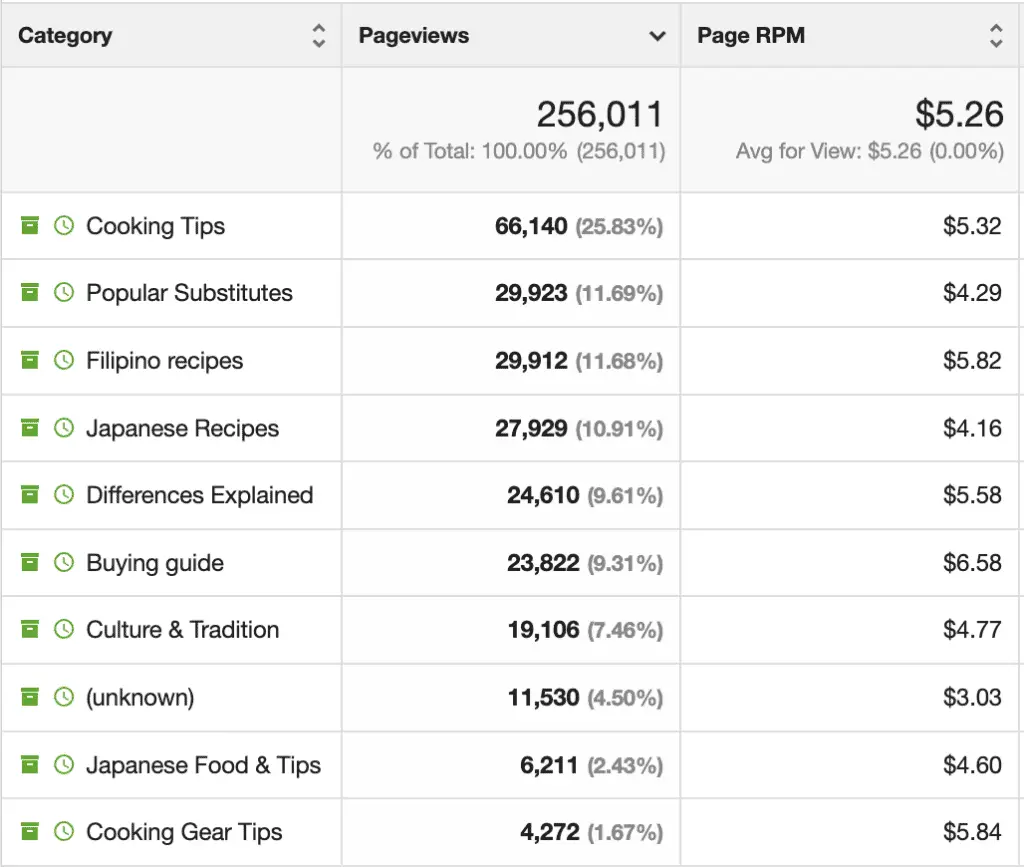
But I do see the buying guide articles tend do do much better in terms of revenue than other types of articles.
Sites
This report let’s you compare your sites next to eachother. It has helped me determine where I need to put most of my effort.
I very much like the fact that Ezoic let’s me see my data for all of my sites together, on any of the reports.
When using Google analytics, I can only see one site at a time. And even with my own Google Data Studio report I can’t blend them together.
So having the data on my sites together, like the total pageviews of all of my sites is a great asset that I use often.
But comparing each of your sites to the others is also very useful to see where your efforts pay off the most.
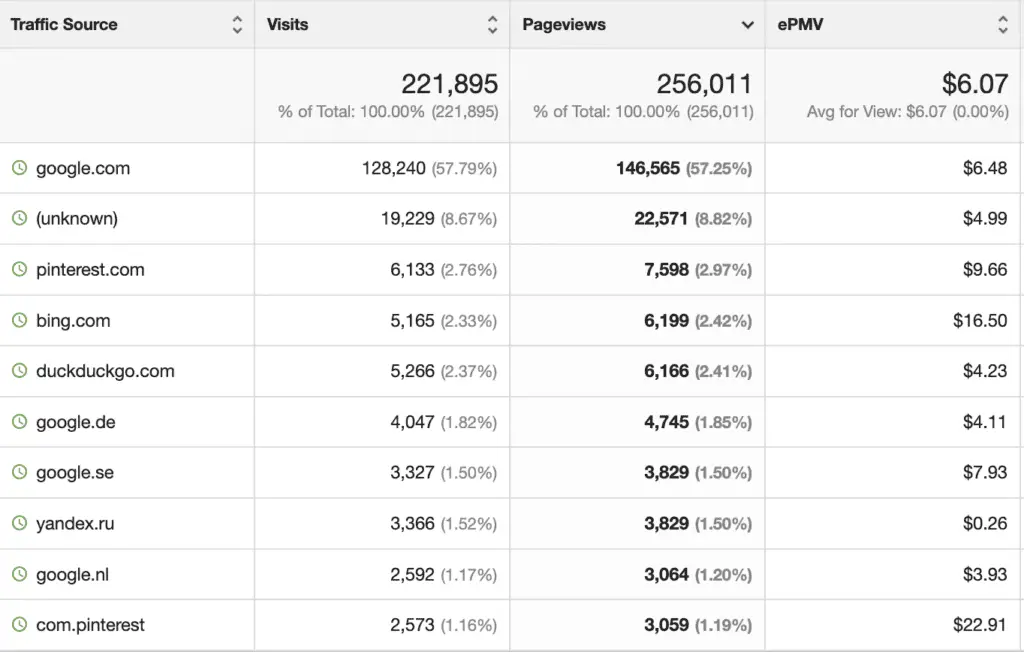
Traffic Source
This is also a great report to check differences in ePMV or engagement rate.
If you have a strategy that involves lot’s of different traffic sources, like Pinterest or Facebook next to Google traffic, this report can show you where you should put most of your effort.
Pinterest is a high-value traffic source for me, for example.
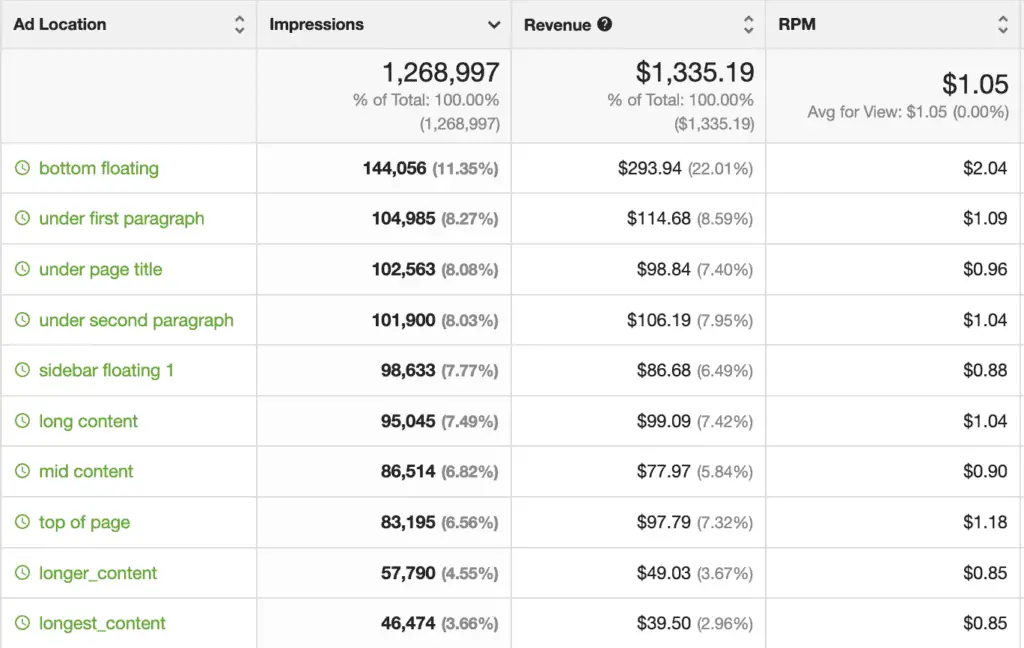
Ad Location
If you’re optimizing your ad placements, or want to decide if all those ads at the top of the page are worth it from a UX standpoint, the Ad Location report is the one to look at.
I’m still considering removing ads in the header, but I haven’t dared to because the yield is so high.
The better names you give your placeholders, the better this report will look, of course. But the standard names, like sidebar floating, are already very informative.
Humix
If you’re into video publishing like I am, the Humix network is a great way to share your videos and earn more from them.
The Shared report is pretty cool because it lets you see which videos are performing well on the network. This way you can create more videos like that.
I found that the more broad the topics are, the better they perform because they can be shared across a lot of pages, instead of just a very niche topic.
And Humix isn’t saturated with a lot of videos yet, so I think it’s kind of the opposite strategy from what you would do on Youtube.
Some things to check once in a while
There are some things you won’t use regulary, unless you’re working on solving a particular issue of course.
But it’s good to check these from time to time
- Site speed and especially the Request Timing Report over time which shows you if there are any issues with your pages loading so you can intervene
- Core Web Vitals to check if you’re on par. I use the Search Console report for reporting on this, but I have had a cumulative layout shift issue and this Ezoic report let’s me see the data per page so I could find out what type of content caused the issues.
- Caching: you can clearly see the difference in loading time between a cache hit or miss. That’s why Ezoic LEAP and the Ezoic Cloud are so important. You need to keep the cache hits high and checking this every now and then is good practice.
Conclusion
Big Data Analytics is one of the reasons I use Ezoic for my display ads (that and they’re the best Adsense alternative for non-US traffic) because it gives a lot of insights that other platforms just don’t give, and for free!
Go out there and make your niche site better with informed decisions.

Joost Nusselder is The Content Decoder, a content marketer, dad and loves trying out new tools en tactics. He's been working on a portfolio of niche sites since 2010. Now since 2016 he creates in-depth blog articles together with his team to help loyal readers earn from their own succesful sites.